
Negative Gearing & CGT Reform 2026: What Happens to House Prices in Each Capital City?
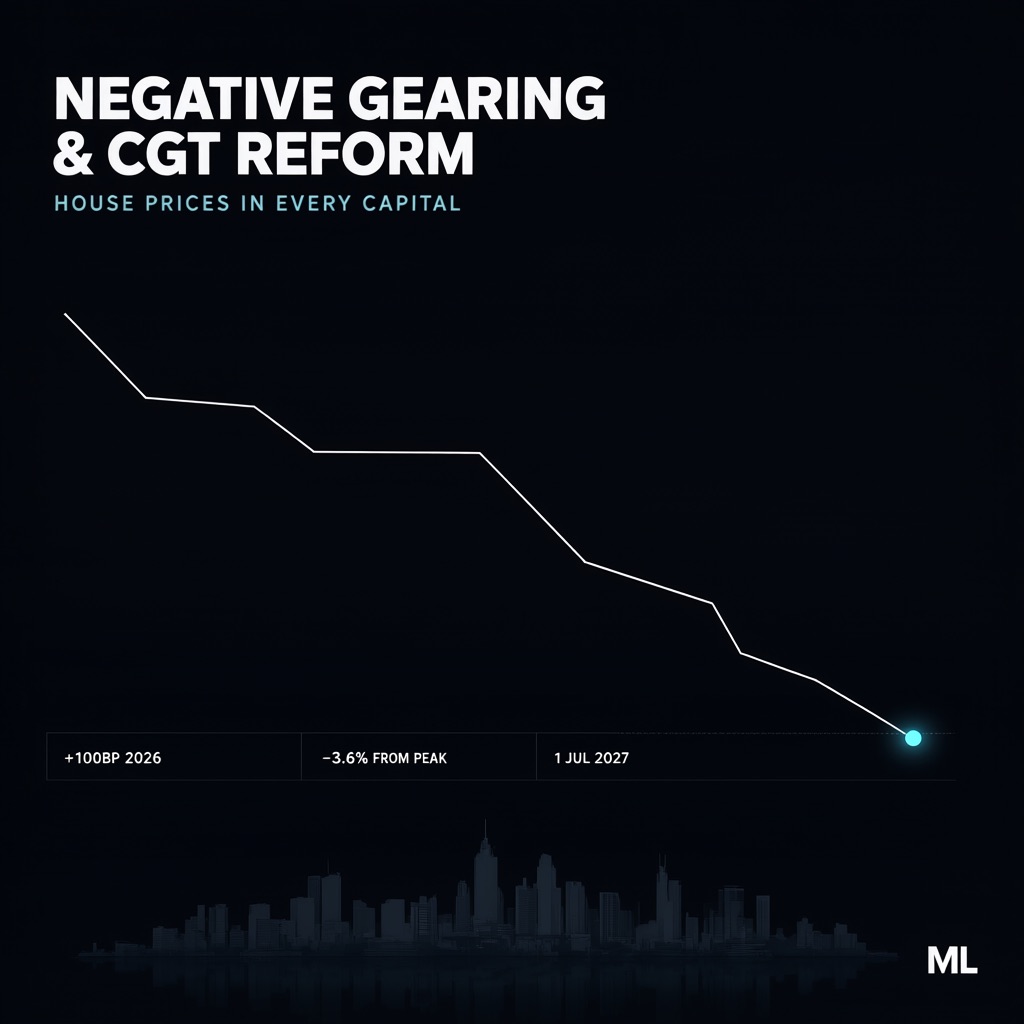
Illustration · image created for this article
Three forces hit Australian house prices in the same year: the Reserve Bank raised the cash rate by a full percentage point to 4.60 per cent — its highest level since November 2011 — Parliament legislated the biggest change to negative gearing and the capital gains tax discount in four decades, and the government's 5% deposit scheme kept first-home-buyer demand flowing with no caps on places.
The result is not one national market but eight very different capital-city stories. National values are 3.6 per cent below their March peak; Sydney is 7.1 per cent below its February high, while Darwin is still setting records.
Below: what each policy does, what it costs a mortgage, the per-city breakdown, the negative-equity question facing 5%-deposit buyers, and — labelled as estimates throughout — what the modelling says comes next.
The year, in short
- Cash rate
- 3.60% → 4.60% — four 25bp rises (3 Feb, 17 Mar, 5 May, 29 Sep 2026)
- Vote to watch
- March rise passed 5–4; September rise unanimous
- Highest since
- November 2011
- Inflation
- 4.0% headline, 3.6% trimmed mean (August 2026)
- Tax Reform No. 1 Act
- Passed the House 4 June 2026; NG quarantine + CGT indexation from 1 July 2027
- Grandfathered
- Holdings before 12 May 2026 · new builds exempt
- 5% deposit scheme
- No caps, no income test from 1 Oct 2025 · 39,704 loans Oct–Apr
- National values
- −3.6% from the March 2026 peak (Cotality, Aug 2026)
- City extremes
- Sydney −7.1% from peak · Darwin still at its peak
What the rate rises cost a mortgage
Repayments on illustrative loans
| Loan (30-yr P&I) | Dec 2025 (5.48%) | Jul 2026 observed (6.19%) | Change | Scenario (6.48%) |
|---|---|---|---|---|
| $500,000 | $2,833 | $3,059 | +$226 | $3,154 (+$321) |
| $600,000 | $3,399 | $3,671 | +$272 | $3,785 (+$385) |
| $750,000 | $4,249 | $4,589 | +$340 | $4,731 (+$482) |
M = P·i/(1−(1+i)−n), i = annual rate ÷ 12. Observed column: RBA Table F6, owner-occupier outstanding P&I rates, monthly, data through July 2026. The scenario column assumes the full 100bp cash rise passes through — it is a scenario, not an observation. Loan sizes are illustrative; median-loan data is not published monthly.
Tax Reform No. 1 Act 2026: the changes, explained
This is no longer a proposal. The Treasury Laws Amendment (Tax Reform No. 1) Act 2026 — announced in the 12 May Budget and passed the House of Representatives on 4 June with Greens and independent support — makes two structural changes, both starting 1 July 2027:
- Negative gearing, quarantined. Net rental losses on dwellings acquired from 7.30pm on Budget night (12 May 2026) can only be deducted against rental income or residential capital gains — not salary. Existing holdings are grandfathered, and new residential builds are exempt under a “genuinely adding to housing supply” test.
- The 50% CGT discount, replaced. From 1 July 2027, individuals and trusts get cost-base indexation (only real gains taxed) plus a 30% minimum tax on capital gains, including on pre-1985 assets. New-build and affordable-housing investors may keep the 50% discount by choice.
- The stated rationale. The Explanatory Memorandum is explicit: negative gearing plus the discount “contribute to low or sometimes negative effective tax rates on property investments… strong incentives for investors to take on highly leveraged housing investments. This contributes to higher house prices — as investors bid up the price on a scarce resource.”
The scale of what is being reformed: 2.34 million taxpayers held rental property in 2023–24, and 54.2% of them made a rental loss (ATO). Investors were 39% of new dwelling loans in the June quarter — down 8.6% on the quarter as the reform was debated (ABS). Treasury costs the package at $3.6 billion over the forward estimates, ramping as the measures phase in; the Treasurer has indicated “just over $40 billion over 10 years”.
The 5% deposit scheme: uncapped demand at the top of the cycle
From 1 October 2025 the First Home Guarantee dropped its income caps, waitlists and place limits. Between October 2025 and April 2026, 39,704 government-backed loans were written at a 95% median loan-to-value ratio and a 4.7 median debt-to-income ratio (Housing Australia) — a cohort that bought near the peak with the thinnest equity buffer, weeks before the market turned. One in three first-home buyers nationally was scheme-supported in 2024–25, and 35% of post-expansion users earned above the scrapped income caps.
The caps now sit mid-market: Sydney's house median ($1.49m) is essentially at the $1.5m cap; Melbourne's typical dwelling is fully eligible under its $950,000 cap; Brisbane, Adelaide, Perth and Hobart medians have all climbed above theirs. The scheme-eligible band is exactly where 2026's falls concentrated.
House prices in each capital city
The same 100 basis points lands very differently in each city. The sorting variable is not yield alone — it is the total investor return: yield, plus rent growth, minus rate cost, moderated by how tight the local rental market is. All values are Cotality's August 2026 index (released 1 September 2026); rents and vacancies are Cotality and SQM Research.
| City | Median | m/m | y/y | From peak | Rent y/y | Vacancy |
|---|---|---|---|---|---|---|
| Sydney | $1,222,718 | −1.4% | −4.6% | −7.1% | +5.4% | 1.7% |
| Melbourne | $786,718 | −1.1% | −4.7% | −6.8% | +6.1% | 1.8% |
| Brisbane | $1,080,142 | −1.0% | +10.8% | −2.7% | +7.7% | 0.9% |
| Perth | $999,987 | −0.8% | +15.6% | −3.2% | +7.1% | 0.6% |
| Adelaide | $937,207 | −0.8% | +8.6% | −1.6% | +3.4% | 0.6% |
| Canberra | $864,998 | −1.1% | −0.4% | −5.2% | +3.3% | 2.1% |
| Hobart | $752,397 | −0.2% | +8.1% | −1.1% | +10.4% | 0.6% |
| Darwin | $647,259 | +0.6% | +14.6% | 0% | +8.7% | 0.4% |
Cotality Home Value Index, August 2026 index (released 1 Sep 2026); rents: SQM Research combined rents y/y (released 15 Sep 2026); vacancy: SQM August 2026. Cotality's own national vacancy measure is 1.9% on a different methodology — the two are not comparable and are never averaged here. Values and rents are vendor estimates.
- Sydney — falling fastest from the peak. The highest values, the lowest rental yield (3.3%), and the only major rental market genuinely loosening: vacancies at 1.7% with 26% more vacant dwellings than a year ago — still a tight market in level terms. Values are 7.1% below the February peak, falling faster at the same point than in the 2022–23 correction; sales volumes are down more than 20%. The reform bites hardest here, and the house median sits almost exactly at the scheme cap.
- Melbourne — the same diagnosis, a lower level. −4.7% year-on-year, 6.8% below its November 2025 cyclical peak, vacancy 1.8%. The typical dwelling is fully scheme-eligible, so first-home demand provides a real floor — but sub-cap values have still fallen, which is what puts 95%-LVR buyers near negative equity.
- Brisbane — easing from the peak, tight rentals. Still +10.8% year-on-year but down every month from the May peak (July revised to −1.2%). The cushion: 0.9% vacancy and rents up 7.7%. The house median now exceeds the $1m scheme cap.
- Perth — momentum fading, no rental relief. +15.6% year-on-year still leads the nation, but July was revised from +0.1% to −1.3%. With 0.6% vacancy and rents up 56% over five years, landlords' total returns still work — this is where rising rates squeeze buyers, not investors.
- Adelaide — steepest monthly fall of the cycle. −0.8% in August, though still +8.6% year-on-year and only 1.6% below the May peak. The median has crept above the $900,000 scheme cap; vacancy is 0.6%.
- Canberra — behaving like Sydney, at half the price. The loosest rental market in the country (2.1% vacancy, up 29% in a year), weak rent growth, and values 5.2% below the 2022 peak. The ACT pay packet absorbs rate rises better, but the direction matches Sydney's.
- Hobart — the rent cushion. Barely falling (−0.2%) while posting the strongest rent growth of any capital: +10.4% year-on-year, units +16.5%. With 0.6% vacancy, landlord yields (4.4%) are doing the work rates are trying to undo.
- Darwin — the outlier still rising. The only capital at its peak and the only one to rise in August (+0.6%). A 6.3% yield and 0.4% vacancy make it the least rate-exposed market — though SQM cautions its tiny rental stock (94 vacant dwellings) makes the numbers volatile.
The 5% deposit scheme vs falling prices: the negative-equity question
Here is where the three policies intersect. One analysis (SuburbData, via realestate.com.au, 29 September 2026) found 41.9% of below-cap Sydney properties fell more than 5% between October 2025 and August 2026 — an average loss of about $83,000 — with roughly half of below-cap Melbourne properties and a quarter of Brisbane's also down. Note that a below-cap sample selects the most exposed cohort: all-Sydney values are 7.1% below peak on the Cotality index.
The honest reading of the safety data: official arrears were 0.3% (90+ days) as at end-December 2025 — better than the major banks — but that is a lagging indicator measured before the May and September rises and most of the price falls. Treasury had set aside $35.7m for default contingencies and is re-reviewing the exposure. The first real stress read will be mid-2027 data; anyone telling you the risk is resolved is ahead of the evidence.
For renters and aspiring buyers the same data reads the other way: national rents are up 5.7% year-on-year (Cotality) or 7.3% (SQM) while values fall — deposit targets shrink slower than rents grow, and the yield recovery (3.79%, the highest since 2019) is landlords' good news, not tenants'.
The contested question: prices and rents after the reform
Every number in this section is a model or a forecast. What each source projects:
| Source | Price effect | Rent effect |
|---|---|---|
| Treasury (Budget forecast) | Growth ~2% lower over a few years | ~+$2/week |
| Grattan Institute (modelling) | ~1–2% lower | ~+$1/week |
| Uni of Melbourne (full abolition) | Supply −1.8% | +2.5% (≈$15–16/wk) |
| Tulip (CIS) / Phillips (ANU) | Tax worth 1–4% vs zoning 30–50% | “Not the major player” |
All figures are estimates or forecasts, not observations. The Treasury and Grattan rent figures are dollar amounts under their own assumptions; the University of Melbourne figure models a full abolition — a stronger policy than the legislated quarantine — so the scenarios are not directly comparable.
“Contrary to urban myth, rents wouldn't change much, nor would housing markets collapse.”
Grattan Institute — Orange Book 2025
“These tax concessions have 1 to 4 per cent effect on house prices, [whereas] zoning… estimates put it at 30 per cent to 50 per cent effects on house prices.”
Peter Tulip, Centre for Independent Studies — via ABC News
“Whenever governments do things that allow people to spend more on housing than they would have otherwise, they end up spending more on housing.”
Saul Eslake, economist — on the 5% deposit scheme, via Guardian Australia
The 1985–87 Hawke–Keating abolition is cited by both sides, and the dispute is about magnitude, not facts: industry groups say the freeze caused a rent spike; Grattan's rebuttal is that Sydney and Perth rents jumped in 1987–88, two years after re-gearing was restored, tracking local vacancy cycles instead. Also unresolved: the industry warning that small “mum and dad” landlords — who cannot easily pivot to new builds — will exit, cutting rental stock even if prices barely move; REIA modelling claims ~25,500 fewer homes over five years. And the timing wrinkle that matters for 2026: grandfathering deadlines create a pull-forward of investor purchases ahead of Budget night, which may have helped inflate the February–May peak itself — that hypothesis is consistent with the data but cannot yet be separated from the rate effect.
The forward risk the linear forecasts cannot capture is a 2027 cliff: when quarantine starts on 1 July 2027, investors who bought between May 2026 and mid-2027 face the new rules with falling collateral values — the conditions for a disorderly investor exit that a point-estimate forecast does not model.
Questions, answered
Will negative gearing reform crash house prices?
The published estimates point to a modest effect, not a crash. Treasury forecasts price growth about 2% lower over the next few years; Grattan modelling suggests prices around 1–2% lower; sceptics put the tax concessions' contribution at just 1–4% of prices, versus 30–50% for zoning. These are all estimates, not observations.
Do first home buyers with a 5% deposit risk negative equity?
Some do. Around 39,704 government-backed loans were written between October 2025 and April 2026 near the market peak, at a 95% median loan-to-value ratio. One analysis found 41.9% of below-cap Sydney properties fell more than 5% between October 2025 and August 2026. Official arrears data, from December 2025, still showed low stress — but it predates the May and September rate rises.
Which capital city will fall the most?
On the evidence so far, Sydney has fallen furthest from its peak — 7.1% below its February 2026 high, with values down 4.6% year-on-year. Melbourne is next at 6.8% below its 2022 peak. The supply-constrained cities — Perth, Adelaide, Brisbane, Hobart and Darwin — are cushioned by vacancy rates at or below 0.9%.
How much do RBA rate rises add to my mortgage?
On the RBA's observed data, average outstanding owner-occupier variable rates rose from 5.48% in December 2025 to 6.19% by July 2026 — about $280 a month more on a $650,000 25-year loan. If the full 100 basis points pass through, the scenario cost is closer to $400 a month.
Does the CGT discount change apply to property I already own?
The Act applies the new indexation-plus-30%-minimum-tax rules to gains accruing from 1 July 2027, including on pre-1985 assets, with transitional deemed-sale treatment. Dwellings acquired before Budget night (7.30pm, 12 May 2026) keep negative gearing treatment, and new-build and affordable-housing investors can choose to keep the 50% discount. Check the ATO guidance or a licensed adviser for your position.
Will rents rise because of negative gearing reform?
The estimates are small but positive: Treasury forecasts rents about $2 a week higher; Grattan about $1 a week; University of Melbourne modelling of a full abolition — a stronger policy than the legislated quarantine — found rents 2.5% higher. The 1985–87 abolition is cited by both sides, with the dispute centred on timing attribution.
Is negative gearing being abolished in 2026?
No. The Treasury Laws Amendment (Tax Reform No. 1) Act 2026 quarantines rental losses for dwellings acquired on or after 12 May 2026, effective 1 July 2027, and replaces the 50% CGT discount with indexation plus a 30% minimum tax. Existing holdings are grandfathered and new builds are exempt, so negative gearing itself remains.
Sources
- Reserve Bank of Australia — Monetary Policy Board statements, 2026
- Reserve Bank of Australia — Lenders' Interest Rates (Table F6)
- Treasury Laws Amendment (Tax Reform No. 1) Act 2026 & Explanatory Memorandum
- Parliamentary Library — Bills Digest No. 67, 2025–26
- ATO — Taxation Statistics 2023–24; CGT discount guidance
- Australian Bureau of Statistics — CPI; Total Value of Dwellings; Lending Indicators; Building Approvals
- Cotality (CoreLogic) — Home Value Index, September 2026 publication
- SQM Research — vacancy rates and asking rents
- Housing Australia — Home Guarantee Scheme Trends & Insights 2024–25
- Grattan Institute — Orange Book 2025; ABC News (1 Oct 2024) estimates roundup
- Senate estimates reporting — Guardian Australia (7 Jul 2026); realestate.com.au / SuburbData (29 Sep 2026)
Not financial advice. This article is general commentary on publicly released data from the Reserve Bank of Australia, the Australian Bureau of Statistics, Cotality, SQM Research and published policy research, written on 30 September 2026. It does not take your objectives, financial situation or needs into account. Price and rent impacts of the Tax Reform No. 1 Act are estimates and forecasts published by Treasury, the Grattan Institute and academic modellers under stated assumptions; actual outcomes will differ. Repayment figures are modelled scenarios with stated assumptions, not quotes from any lender. Consider whether the information suits your circumstances and, where relevant, speak to a licensed financial adviser.
Found this useful?
Buy me a coffee ☕
Everything here is free and ad-free. A coffee or a AU$1/month membership keeps new articles, games and tools coming.
Also in the shop: VoidFill · The Architect’s Monologue · Brisbane photo prints